About EleksyonPH
ElectionPH is a fully interactive and publicly accessible web application designed to visualize Philippine election results at different administrative scales. It aims to provide transparency, ease of exploration, and a dynamic user experience, allowing anyone to explore detailed election data in an intuitive, data-driven environment.
The application operates through three primary modes, each representing a distinct administrative level. Every dataset, popup, chart, and search index dynamically changes depending on the active mode: Barangay Mode, Municipality Mode, and Provincial Mode.

Modes of Operation
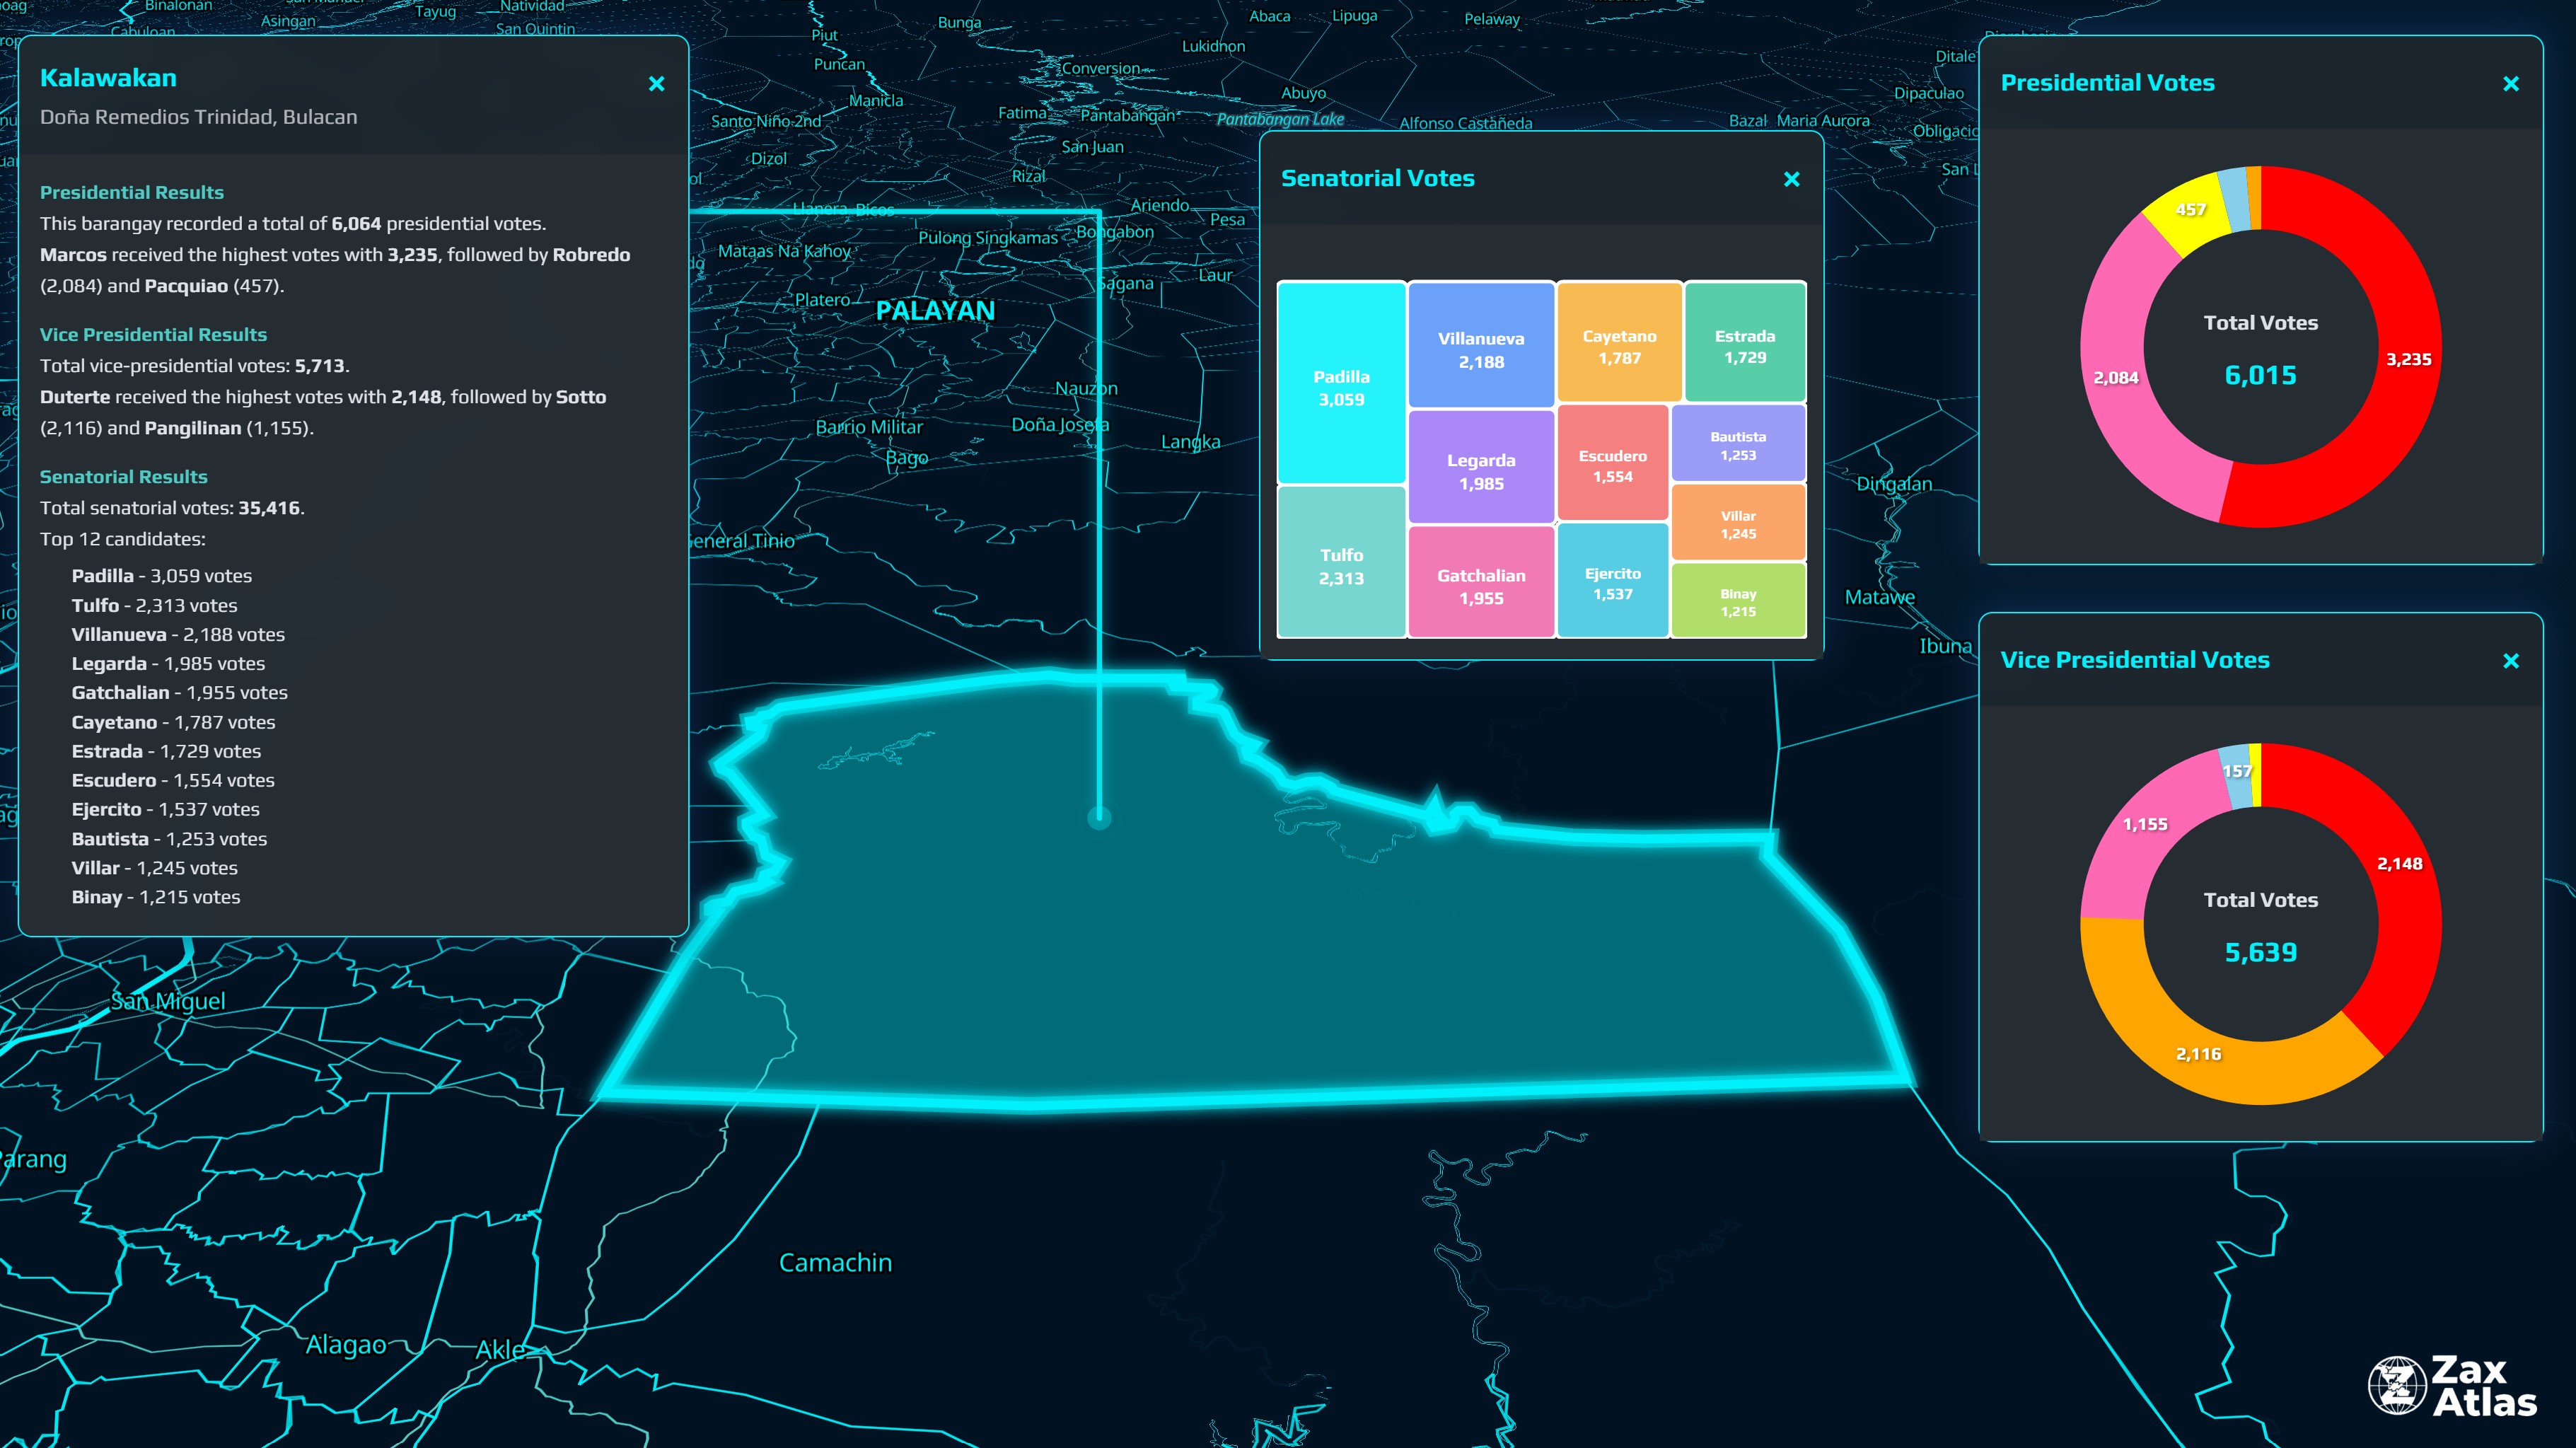
Barangay Mode: When Barangay Mode is activated, the map loads the barangay pmtiles. All interface components — including attribute popups, chart popups, and right-click popups — adapt automatically to barangay-level attributes. The search bar retrieves results only from barangay datasets, ensuring accurate level-specific results.
Municipality Mode: When Municipality Mode is selected, MapLibre automatically fetches the municipality-level GeoJSONs and renders them natively on the map. All UI components adapt dynamically to display municipality-specific data, with charts displaying pre-summarized data from the GeoJSON attributes.
Provincial Mode: When Provincial Mode is activated, MapLibre fetches the provincial-level GeoJSONs and renders them natively. The map's symbology, popups, and search behavior automatically update to show province-level election data, with all visualizations based on pre-calculated summaries in the dataset.
Dynamic Behavior
ElectionPH is built on a mode-aware architecture, meaning every component automatically adjusts to the active administrative level. The dataset loader switches sources depending on mode, attribute and chart popups display mode-specific fields and statistics, and the search function limits results to the current mode scope.
Design and Accessibility
The web app is public-facing. It's designed purely for viewing and data interaction, with responsive UI elements that automatically resize on mobile and desktop devices. The interface aims to balance clarity and aesthetic appeal for both casual viewers and data enthusiasts.
Credits
Developer: Zax Atlas
GIS Platform: MapLibre
Data Sources: Processed GeoJSONs from official COMELEC election results
Design Inspiration: Cyberpunk, Science Fiction
Last updated: November 2025